So here we are, staring at headlines that whisper of a potential Russia–Ukraine peace deal, and useless sell-side analysts that appear on CNBC daily, looking for any excuse to backfit their evergreen “buy” ratings to some type of good news that can continue to explain 40x PEs and an S&P 200,000 target are salivating.
The narrative is obvious: peace means stability, stability means growth, and growth means stocks go higher. But anyone with more than a week’s experience in markets knows how this script can actually end: not with a euphoric rally, but with a “sell the news” thud. Markets don’t run on world peace; they run on liquidity. Take Covid for example: everyone thought the bubonic plague had landed and all life as we knew it was going to stop — so naturally the NASDAQ tripled off its lows after the Fed fire hosed trillions in liquidity, remember PPP, free cash, no payback.
A joke at the time: “The year is 2030. All mankind has died from Covid. A lone server in the basement of the New York Fed continues to bid the Dow to all-time highs.”
Make no mistake, a reversal is overdue. I know, I know — there’s no point in reminding anyone again, because it feels like the market is never going to go down. I’ve been wrong before, loudly, and on more than one occasion. But I also know that when the data screams “bubble,” ignoring it usually doesn’t end well.
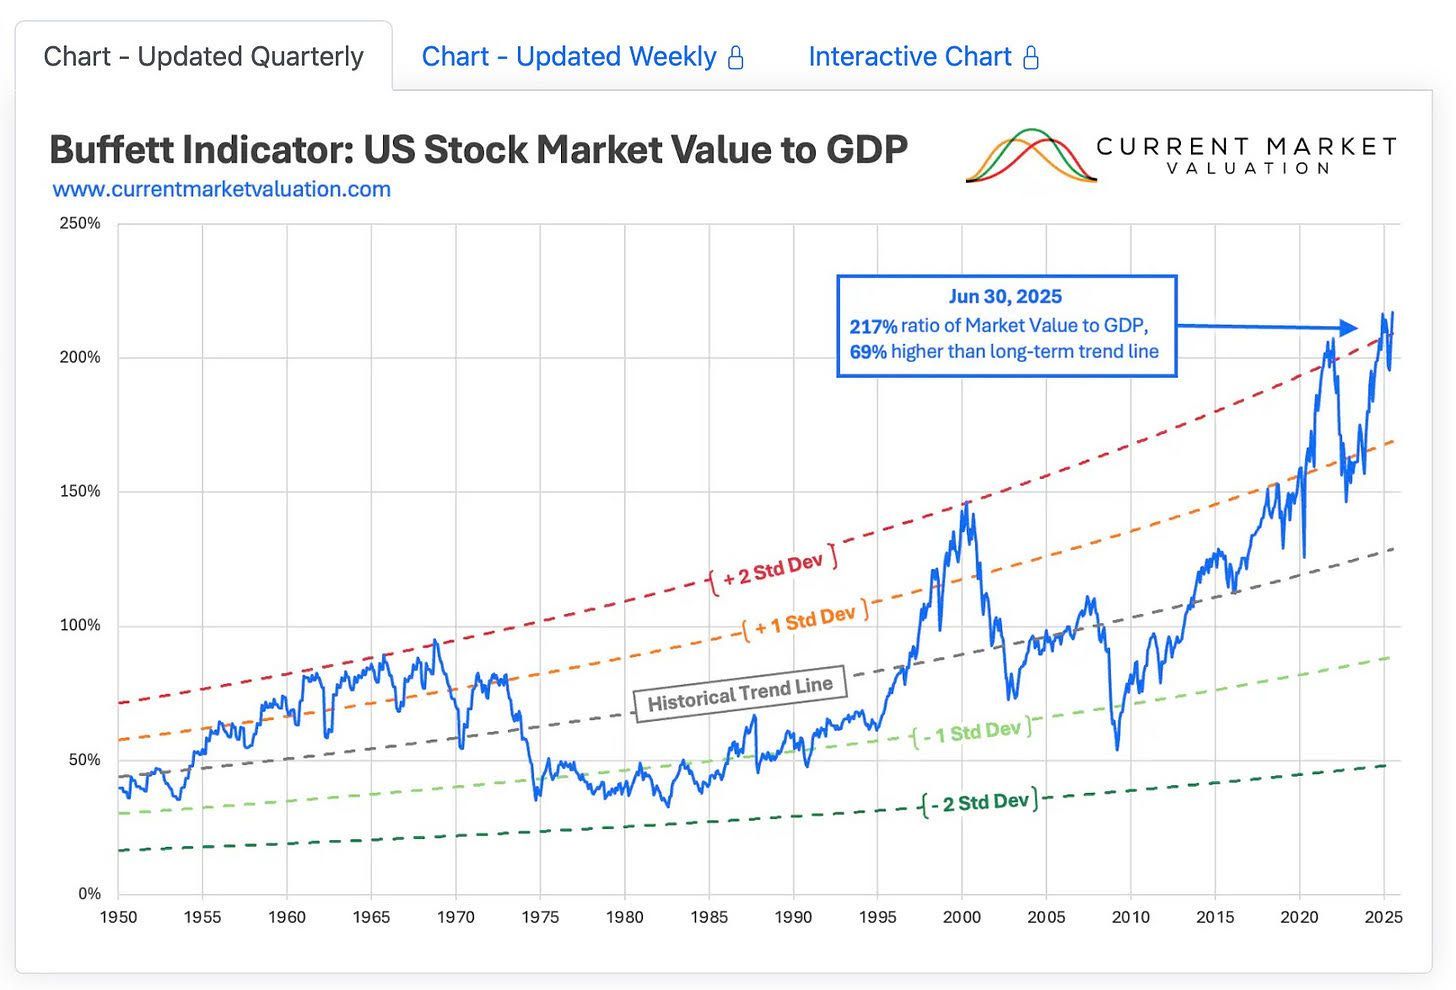
On almost every objective measure, the market is not just expensive — it’s wildly overvalued. June 30th data from CurrentMarketValuation.com doesn’t just say “overvalued” — it says “strongly overvalued,” and it says it across nearly every single model that matters.
Take the Buffett Indicator. It’s sitting around 200% of GDP, more than two standard deviations above its long-term average. The last two times it got anywhere near this level were the dot-com peak in 2000 and again in late 2021. In both cases, investors were treated to drawdowns north of 40%.
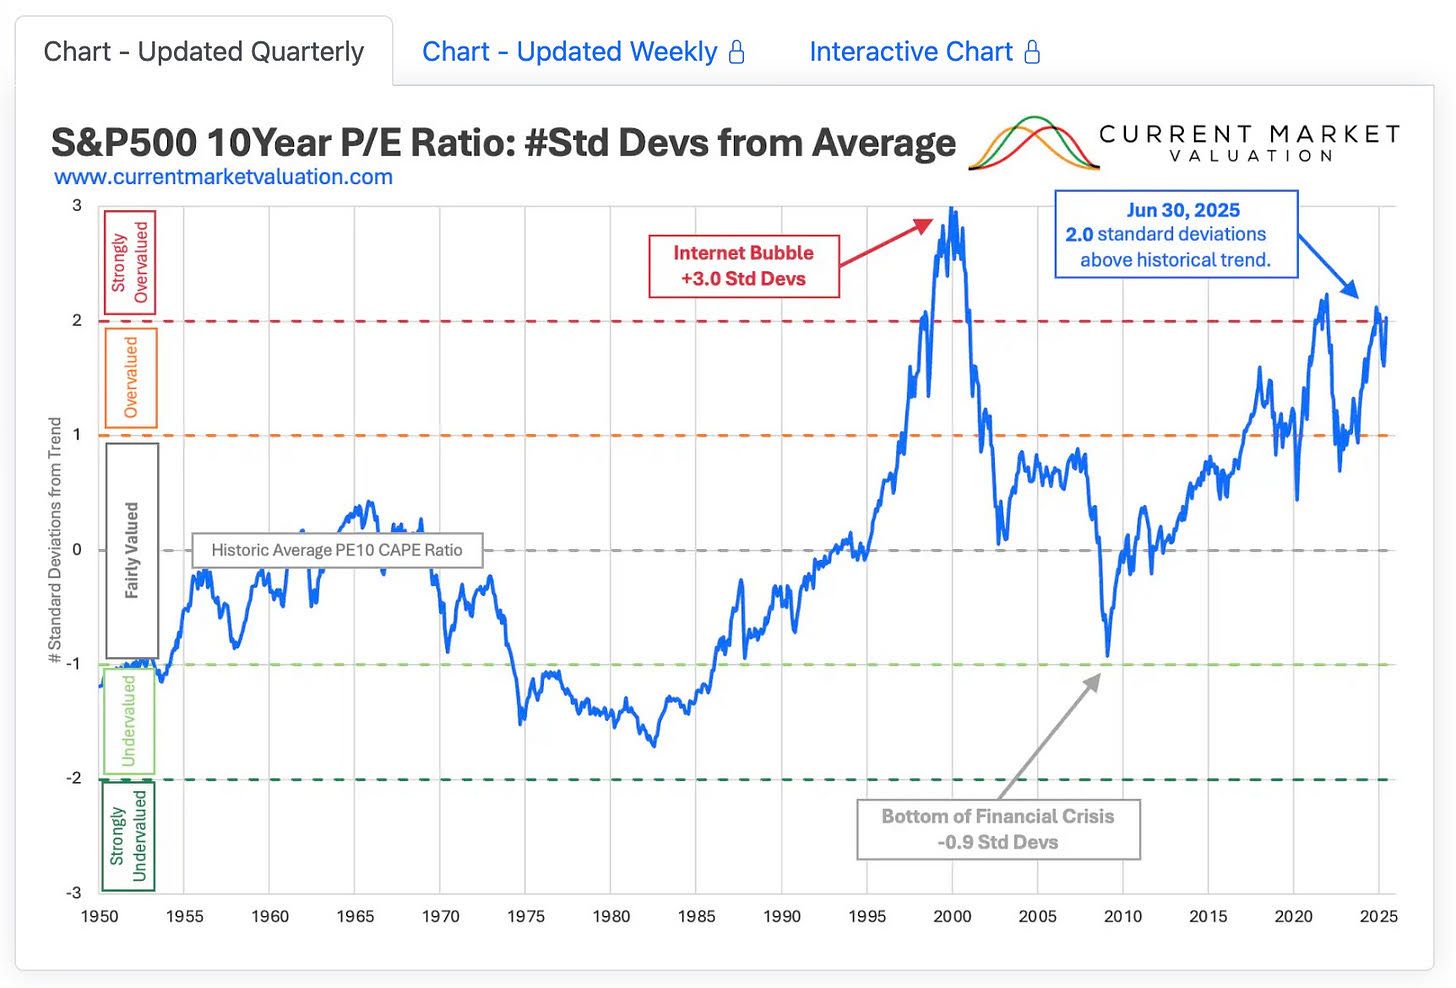
The
CAPE ratio tells the same story: hovering in the mid-30s today, more than two standard deviations above its mean. The
only other times it has reached these levels were
1929 and 2000 — and we all know how those chapters ended.
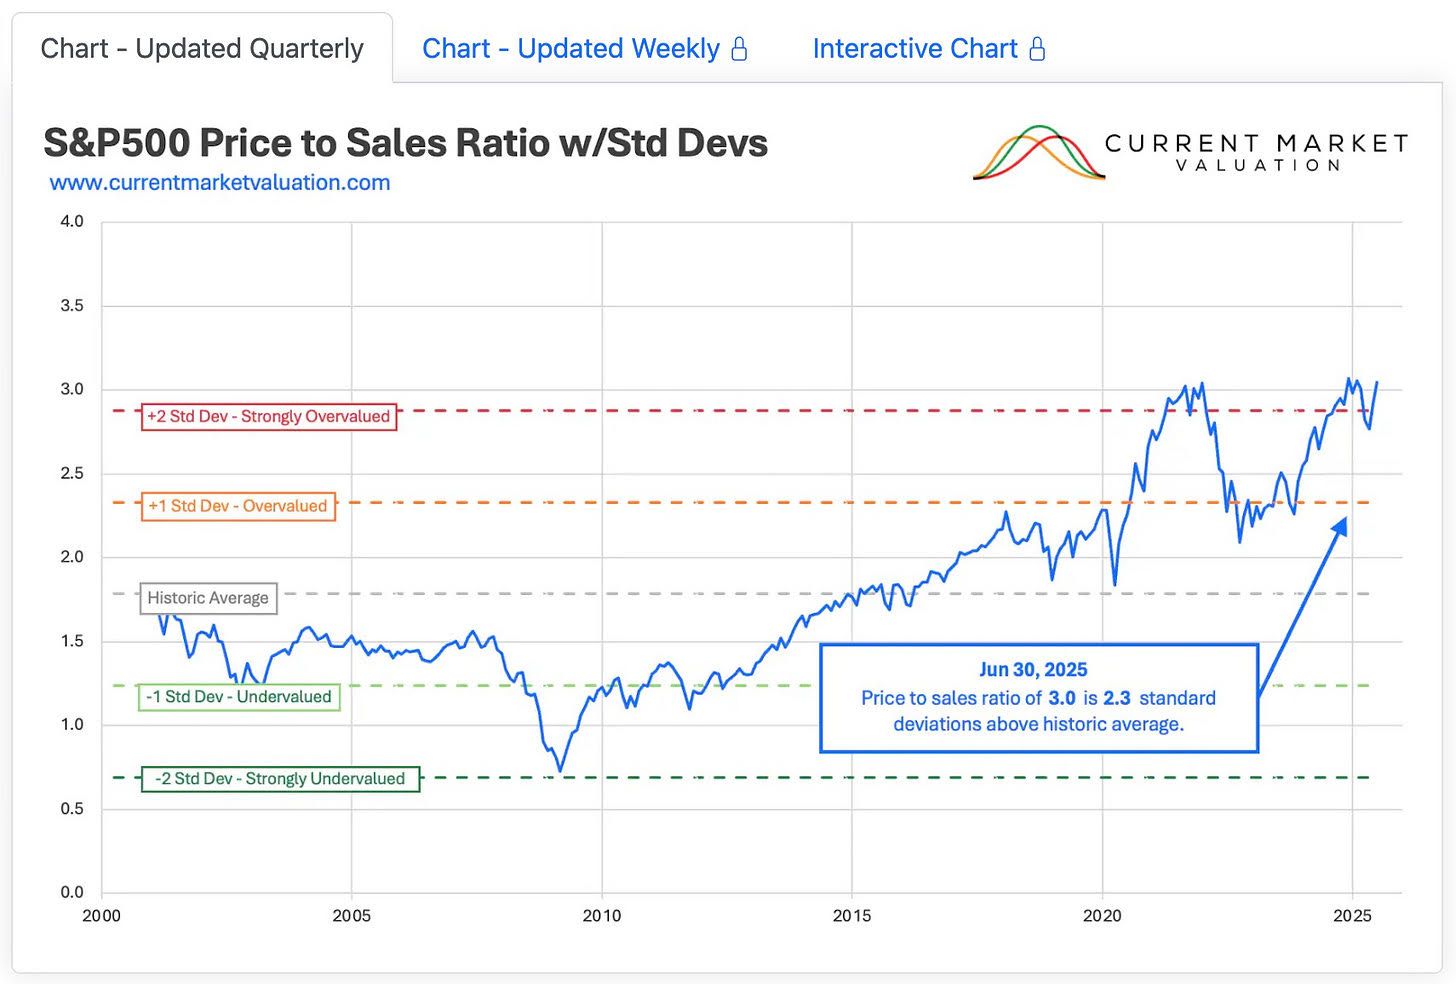
The
price-to-sales ratio is equally stretched. At more than
three standard deviations above trend, the market is literally off the charts. That level of multiple expansion has never been sustained. Every time it’s gotten this far — whether 2000 or 2021 — it has unwound violently.
The mean reversion model, which plots
the S&P 500 against its inflation-adjusted exponential trend line, has the index more than three standard deviations above where history says it should be. The last time it hit that level? Late 2021 — right before a 25% drawdown in 2022. The last time before that? 2000, which needs no introduction, that was the dot com bubble.
Even the interest rate model, which usually gives the market a break when yields are low, is flashing red. With the 10-year Treasury yield above 4% and the S&P 500 sitting near record highs, the model calls equities “overvalued.” Translation: even with rates this high, stocks aren’t cheap relative to bonds. The only metric not screaming bloody murder is the earnings yield gap model, which is “fairly valued.”
But “fair” in this context means equities are simply less outrageously expensive compared to Treasuries — which sold off with equities on the last pullback — not that they’re a bargain.
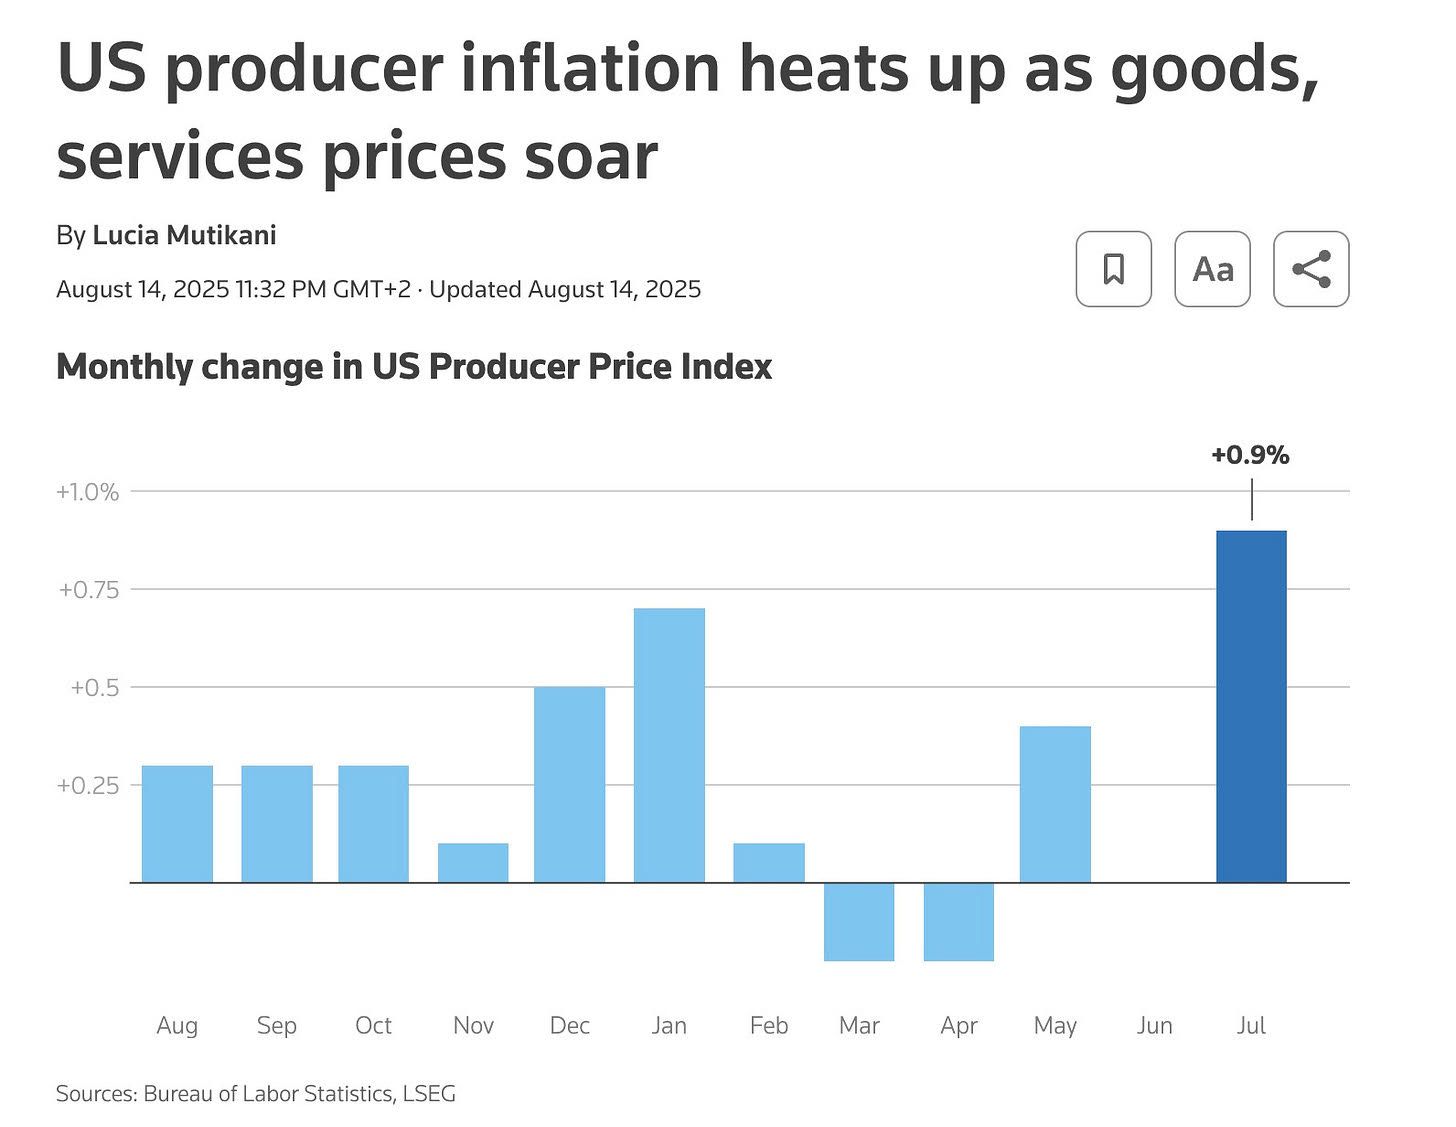
And all of this is happening as macro conditions worsen. The latest PPI report showed producer prices running hotter than expected.
If earnings estimates get revised down — as they inevitably will if rates stay high and costs keep creeping up — today’s stretched valuations get even worse. Expensive becomes unconscionable.
That’s when a feedback loop kicks in: weaker earnings mean weaker hiring. Job losses follow. And job losses are where people start to complain about paying for services. Our company is facing this as we speak as clients as not paying on time and delaying to pay for what they already have received.
Retirement accounts are now north of $40 trillion, and thanks to auto-enrollment and target-date defaults, much of that is funneled into index funds whether or not valuations make sense. Passive has overtaken active management, and the big three firms — Vanguard, BlackRock, State Street — collectively control tens of trillions. Their flows don’t analyze; they just buy. The bigger the stock, the bigger the allocation.
Many have already been borrowing against credit lines instead of liquidating assets. That’s leverage by another name. It works when redemptions are small, but if they build, funds flip into forced sellers at the worst possible moment. This isn’t a side pocket of the market — it’s more than half of U.S. fund assets, wired directly into retirement accounts. Job losses are the silent tripwire. When payrolls crack, the passive bid cracks, and when the passive bid cracks, the market has to drop.
Now, overlay this with crypto — the most volatile risk asset of them all — which is now embedded in the plumbing of the financial system.
I’ve talked to many of you before regarding crypto (insert tulip here……) before about Bitcoin’s “crossing the moat.” Crypto/Bitcoin is no longer knocking on the door; it’s inside the castle, in 401(k)s, ETFs, and corporate treasuries. That integration means a sharp drawdown in crypto wouldn’t just be a sideshow like during the “crypto winter”— it would be a systemic shock. In 2000, it was dot-com stocks. In 2008, it was housing. Today, it could easily be crypto that tips the first domino.
History tells us how this movie ends. When valuations are this far above trend — 1929, 2000, 2008, 2021 — the aftermath isn’t gentle mean reversion. It’s a large drawdown of assets. And every collapse has its catalyst. Maybe it’s a crypto unwind. Maybe it’s the Fed boxed in by inflation. Maybe it’s BRICS announcing a commodity-backed settlement system. Maybe it’s peace in Ukraine, perversely, removing the last bullish narrative. Maybe it’s simply the economy slowing under the weight of positive real rates until earnings crumble. The point is, with valuations this stretched, the catalyst doesn’t matter. The conditions are already there. Real Estate is at risk and rates are not helping.
And when it comes, it won’t be a glide lower. Bulls take the stairs, Bears take the window. And sure, maybe I’ve been the idiot standing by that shaft waving “watch out” while everyone else keeps partying upstairs. But history’s pretty clear about how gravity works — timing has always been my personal curse. Buy in the next six months, but protect yourself along the way.
Written with the help of research of QTR and Fringe Finance